

The Cannabis Act was proclaimed in October 2018 by the Federal Government of Canada amidst much fanfare. At roughly the same time, a major overhaul of impaired driving laws and tools was completed within the Transportation Conveyances Act, put in place to protect road users from impaired driving among other things. This latter legislation received far less airtime despite these two initiatives appearing to be somewhat at odds. On one hand, cannabis legalization was cause for celebration among some Canadians who had long sought legitimate markets to obtain and legally use cannabis products. But on the other, professionals, provincial and municipal governments, academics and advocates expressed concern about the potentially substantial impact on road safety in the form of drug-impaired collisions, drivers and deaths.
 Those of us working in road safety recognized the impending pitfalls in terms of what could go dramatically wrong; cue Indiana Jones navigating a deadly obstacle course of lethal booby traps to capture the treasure. The idea is the easy part; but the seamless execution plan to get the prize is a horse of an entirely different colour. The devil is always in the details. While the Federal government had responsibility for criminal legislation, the provinces had ownership of transportation and health issues, and municipalities had authority for municipal regulations and licencing. Dramatic differences in priorities and processes exponentially complicated the unfolding of this legislation with communities having the most to lose if it didn’t go well.
Speculation was rampant in all quarters, expounding a combination of eager anticipation, analysis and debate about drawbacks. Young drivers were a notable concern due to decades of research demonstrating their elevated risk and over-representation in crashes.
How will Canada crack down on marijuana-impaired drivers?
Wallis Snowdon · CBC News April 25, 2016
Expect more injuries after weed is legalized, U of A report says
Kaylen Small · CBC News April 14, 2018
Slow driver reactions front of mind for Calgary police ahead of cannabis legalization
Bryan Labby · CBC News October 16, 2018
Canadian police ready to deal with legal marijuana, chiefs say
Enforcing new cannabis laws around will be a ‘work in progress’
Karin Larsen · CBC News October 15, 2018

Now, eight years post-legalization, Canadians are wondering what effect this new law had on our roads, and whether concerns were warranted. Research has demonstrated how cannabis impairs essential cognitive and psychomotor skills required to drive safely. Laboratory and simulator studies have shown THC (Tetrahydrocannabinol, is the primary psychoactive chemical that produces impairment) can significantly slow driver reaction time and increase incorrect or delayed responses during sudden emergencies, such as unexpected obstacles (cue the moose) or changes on the road. It hampers a driver’s core attentiveness and spatial awareness, making tasks like maintaining steady lane positioning and controlling speed much more difficult. There is also evidence that mixing cannabis with alcohol can increase impairment due to some distinct impairing effects of each substance.
But how did this research play out in the real world and what does post-legalization data reveal?
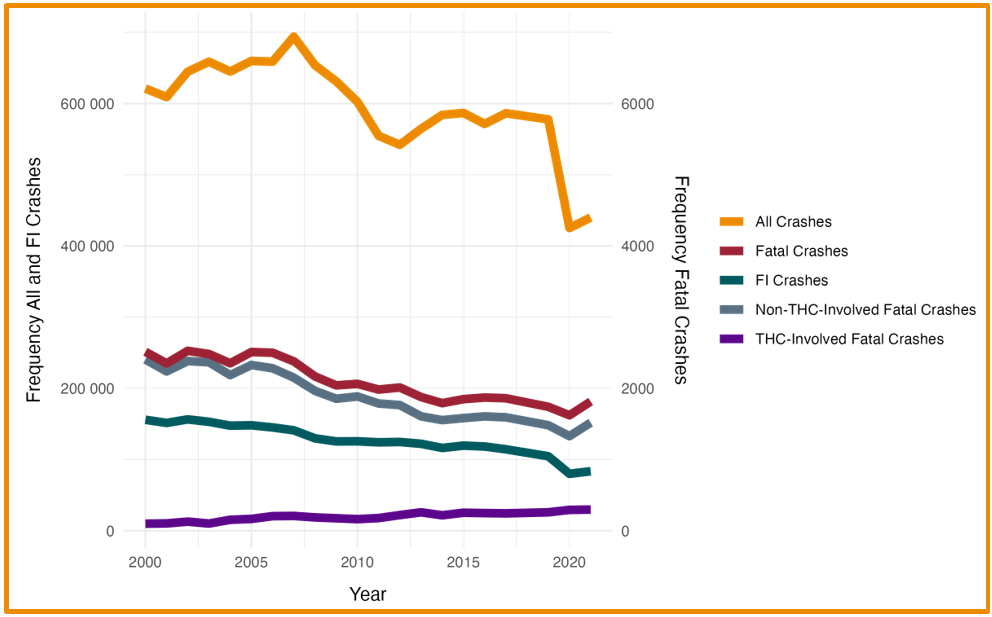
 To answer this question, TIRF analyzed pre- and post-legalization data from police-reported crashes and coroner / medical examiner offices across the country from 2000 to 2021. The objective was to compare trends among all types of crashes not involving THC-positive drivers to trends in fatal crashes involving THC-positive drivers. The figure below plots these data, presenting the scale for crashes and fatal + injury crashes on the left versus all types of fatal crashes on the right. It reveals the majority of crash types consistently declined over time and was evident in relation to all crashes, fatal + injury crashes, fatal crashes, and fatal crashes not involving a THC-positive driver.
In contrast, the trend in fatal crashes involving a THC-positive drivers increased over time. Of importance, part of this increase was due to higher drug-testing rates among drivers dying in a crash. In 2000, slightly more than half (54%) of drivers killed in crashes were tested for substances, compared to a much larger majority (85%) being tested in 2021.
In order to control for this factor as well as other changes during this period (i.e., more kilometres travelled), two different types of analysis were conducted as part of this study. The first was a time-series analysis and the second was a before-after design.
 Think of a time-series analysis as looking at a series of data points collected at regular intervals over a long period of time. For example, in June an office manager started allowing employees to bring their pets to work. The purpose of the analysis is to assess whether the number of pets in the office influenced the number of emails that were unread each day during the January to December period. The strength of this type of analysis is that it can account for underlying trends which may also affect the number of unread emails (e.g., such as the day of the week, employees being out sick, or staff attending a mandatory one-day training exercise each month). For example, if staff attended a mandatory training, or if several staff were out sick there will likely be more unread emails. If these patterns or cycles are not considered, it could mistakenly be concluded that the number of pets in the office impacted the number of unread emails when this might not be the case.
In other words, this technique is used to examine long-term patterns or cycles to understand how predictors of crash risk (i.e., like the distance travelled by vehicles), affect the number of crashes that happen. This tool allows researchers to see if a specific event (like a new law) permanently changed the existing trend with respect to collisions in this case.
 A before-after analysis is more like taking a snapshot of what happened both before an event occurred and also afterwards and then comparing the data from these two periods to see if a pattern or trend changed. For example, another office manager was concerned with the number of reported workplace conflicts. In an attempt to improve the situation, they secretly switched the office coffee machine from a high caffeine dark roast to decaf, then compared the number of reported conflicts in the 30 days before and after.
The results of these two different analytic methods revealed mixed outcomes and the changes detected were small. In other words. it was hard to get a clear or definitive picture of whether cannabis legalization resulted in more crashes or not. Key findings included:
 Total crashes & fatal THC-positive crashes: There was no statistically significant effect of cannabis legalization on total crashes or fatal THC-positive crashes. Although the number of THC-positive fatal crashes trended upward, the analysis showed this steady increase was largely a result of higher THC-testing rates of fatally injured drivers in coroner / medical examiner offices.
- Fatal and injury crashes: The before-after analysis revealed a small but statistically significant 3.9% decrease in all crashes resulting in fatalities or injuries whereas the time-series analysis showed no change due to legalization.
- All fatal crashes: The before-after analysis indicated no change due to legalization. In contrast, the time-series analysis indicated a slight post-legalization upward trend of about 2.5 fatal crashes per month.
 Total crashes & fatal THC-positive crashes: There was no statistically significant effect of cannabis legalization on total crashes or fatal THC-positive crashes. Although the number of THC-positive fatal crashes trended upward, the analysis showed this steady increase was largely a result of higher THC-testing rates of fatally injured drivers in coroner / medical examiner offices.
So, were the predictions true or overhyped?
The overarching conclusion of our study was that as of 2021, there wasn’t evidence of a large-scale surge in traffic crashes or fatalities due to cannabis legalization. However, throughout 2020 and into 2021, stay-at-home orders, work from home trends, and social distancing restrictions were also in play to various degrees, making it harder to draw definitive conclusions.
 At the same time, data suggest that anticipation of harms and consequences was also somewhat off the mark. For example, concern about young drivers was paramount with the Federal Government pre-emptively launching a series of prevention ads targeting younger aged drivers 16-24. However, data post-legalization revealed it was the 25-55 age group that was most likely to test positive for THC in fatal crashes.
And although crash numbers didn’t spike dramatically, an analysis of fatal crashes reveals which factors played a role in risk; some of which were anticipated while others were not:
- Drivers between the ages of 25 and 55 had the highest odds of testing positive for THC.
- Drivers aged 20 to 35 had the highest odds of testing positive for the combination of alcohol and THC.
- Male drivers were significantly more likely than females to test positive for THC, alcohol, or both.
- THC-involved fatal crashes were more likely to be single-vehicle crashes, occur on weekends, and involve speeding.
Moreover, more recent years of data have suggested things are not yet settled. The presence of cannabis in fatally injured drivers increased before rebounding, but not to pre-legalization levels. To illustrated, the percentage of fatally injured drivers testing positive for cannabis generally rose from 22% in 2013 to 30.4% in 2020, before declining to 25.2% in 2022 and 2023. There was also an increase (from 22.4% to 27%) in the average percentage of drivers who tested positive pre- and post-legalization.
Percentage of fatally injured drivers testing positive for cannabis pre- and post-legalization
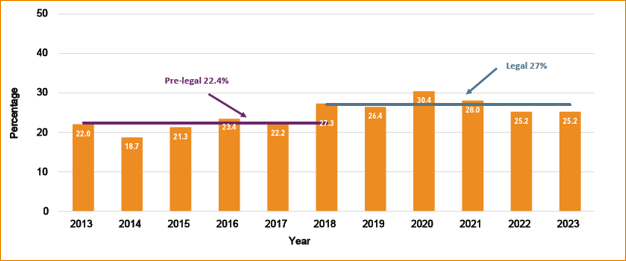
Source: TIRF, Drug Use in Fatal Collisions in Canada | 2000–2023, Figure 11.
 In addition, an examination of differences across age groups using the same pre- and post-legalization periods for cannabis use among fatally injured drivers reveals some stark differences. The percentage of 16-19-year-old fatally injured drivers testing positive declined from 36.5% pre-legalization to 33.7% in the post period. In sharp contrast, the percentage of fatally injured drivers testing positive across all other age groups rose post-legalization, particularly among 20-24-year-old drivers (pre-35.9% to post-46.4%) and drivers aged 65 and older (3.1% to 6.9%).
In other words, the book is not yet closed on this issue.
Moving forward
 The long-term impacts of such a massive policy shift may take years to fully mature, making it imperative that the problem continue to be monitored. In the meantime, insights into who is most likely to drive while impaired by cannabis can help direct funding toward targeted public health campaigns, enforcement strategies, and educational programs aimed directly at these higher-risk groups.
Ultimately, keeping Canadian roads safe in a post-legalization era requires addressing our most glaring information gap, the urgent need for better roadside data and tools. While police officers can be trained as Drug Recognition Experts, they are limited in number. Roadside detection methods any police officer can use that can accurately detect and gauge actual impairment among drivers stopped at roadside can help us better understand the prevalence of cannabis impairment on our roads, instead of waiting to test only those who ultimately arrive in the morgue.
#MySafeRoadHome blog co-authors: Craig Lyon, Director, Road Safety Engineering and Robyn Robertson, TIRF President & CEO, work collaboratively as co-authors. Robyn is the author of TIRF’s knowledge translation model, is well-versed in implementation strategies and operational practices across several sectors. Craig is a senior research scientist with a background in transportation engineering focusing on road safety. Craig’s research interests are in the application of statistical analysis methods to understand the effects of the roadway, drivers and administrative policies on road safety.
Related topics:
 |
 |
 |
 |
Source documents and resources:
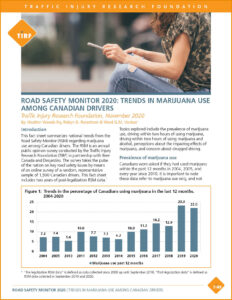
Alcohol, Marijuana & Driving Risk, Traffic Injury Research Foundation, December 2020 https://tirf.ca/download/alcohol-marijuana-driving-risk/
Drug Use in Fatal Collisions in Canada | 2000–2023 https://tirf.ca/download/drug-fatal-collisions-canada-2000-2023/