Life returning to normal may not be the ideal goal
Now more than ever, we all appreciate the benefits of getting outside, being active, and exploring alternate options for commuting or just getting around town. When restrictions began in March due to COVID-19, walking and biking took centre stage as a safer and healthier option for getting around. We saw many jurisdictions across Canada take measures to increase accessibility for pedestrians and cyclists while ensuring the required 2m physical distancing.
Normal vs. #NewNormal
 As restrictions are easing across Canada, some are looking forward to life returning to normal, whereas others are thinking this is an ideal time to reflect on what was working and what wasn’t. Victoria’s historic and picturesque 200-acre Beacon Hill Park implemented vehicle access limitations and pedestrianized the park effective mid-May through the summer to increase opportunities for physical distancing while still allowing access to the park. Discussions are underway about long-term decisions to limit vehicle access, increase parking access for seniors and people with mobility challenges, and encourage pedestrian and biking access. Toronto has similar measures, where over 50 kilometres of roads are closed, only allowing local traffic, giving more space to cyclists and pedestrians while still making it possible to abide by physical distancing rules. In preparation for the #newnormal, Toronto’s city council recently approved 25 kilometres of new cycling infrastructure to help ease the stress on public transit and vehicle traffic as some return to work.
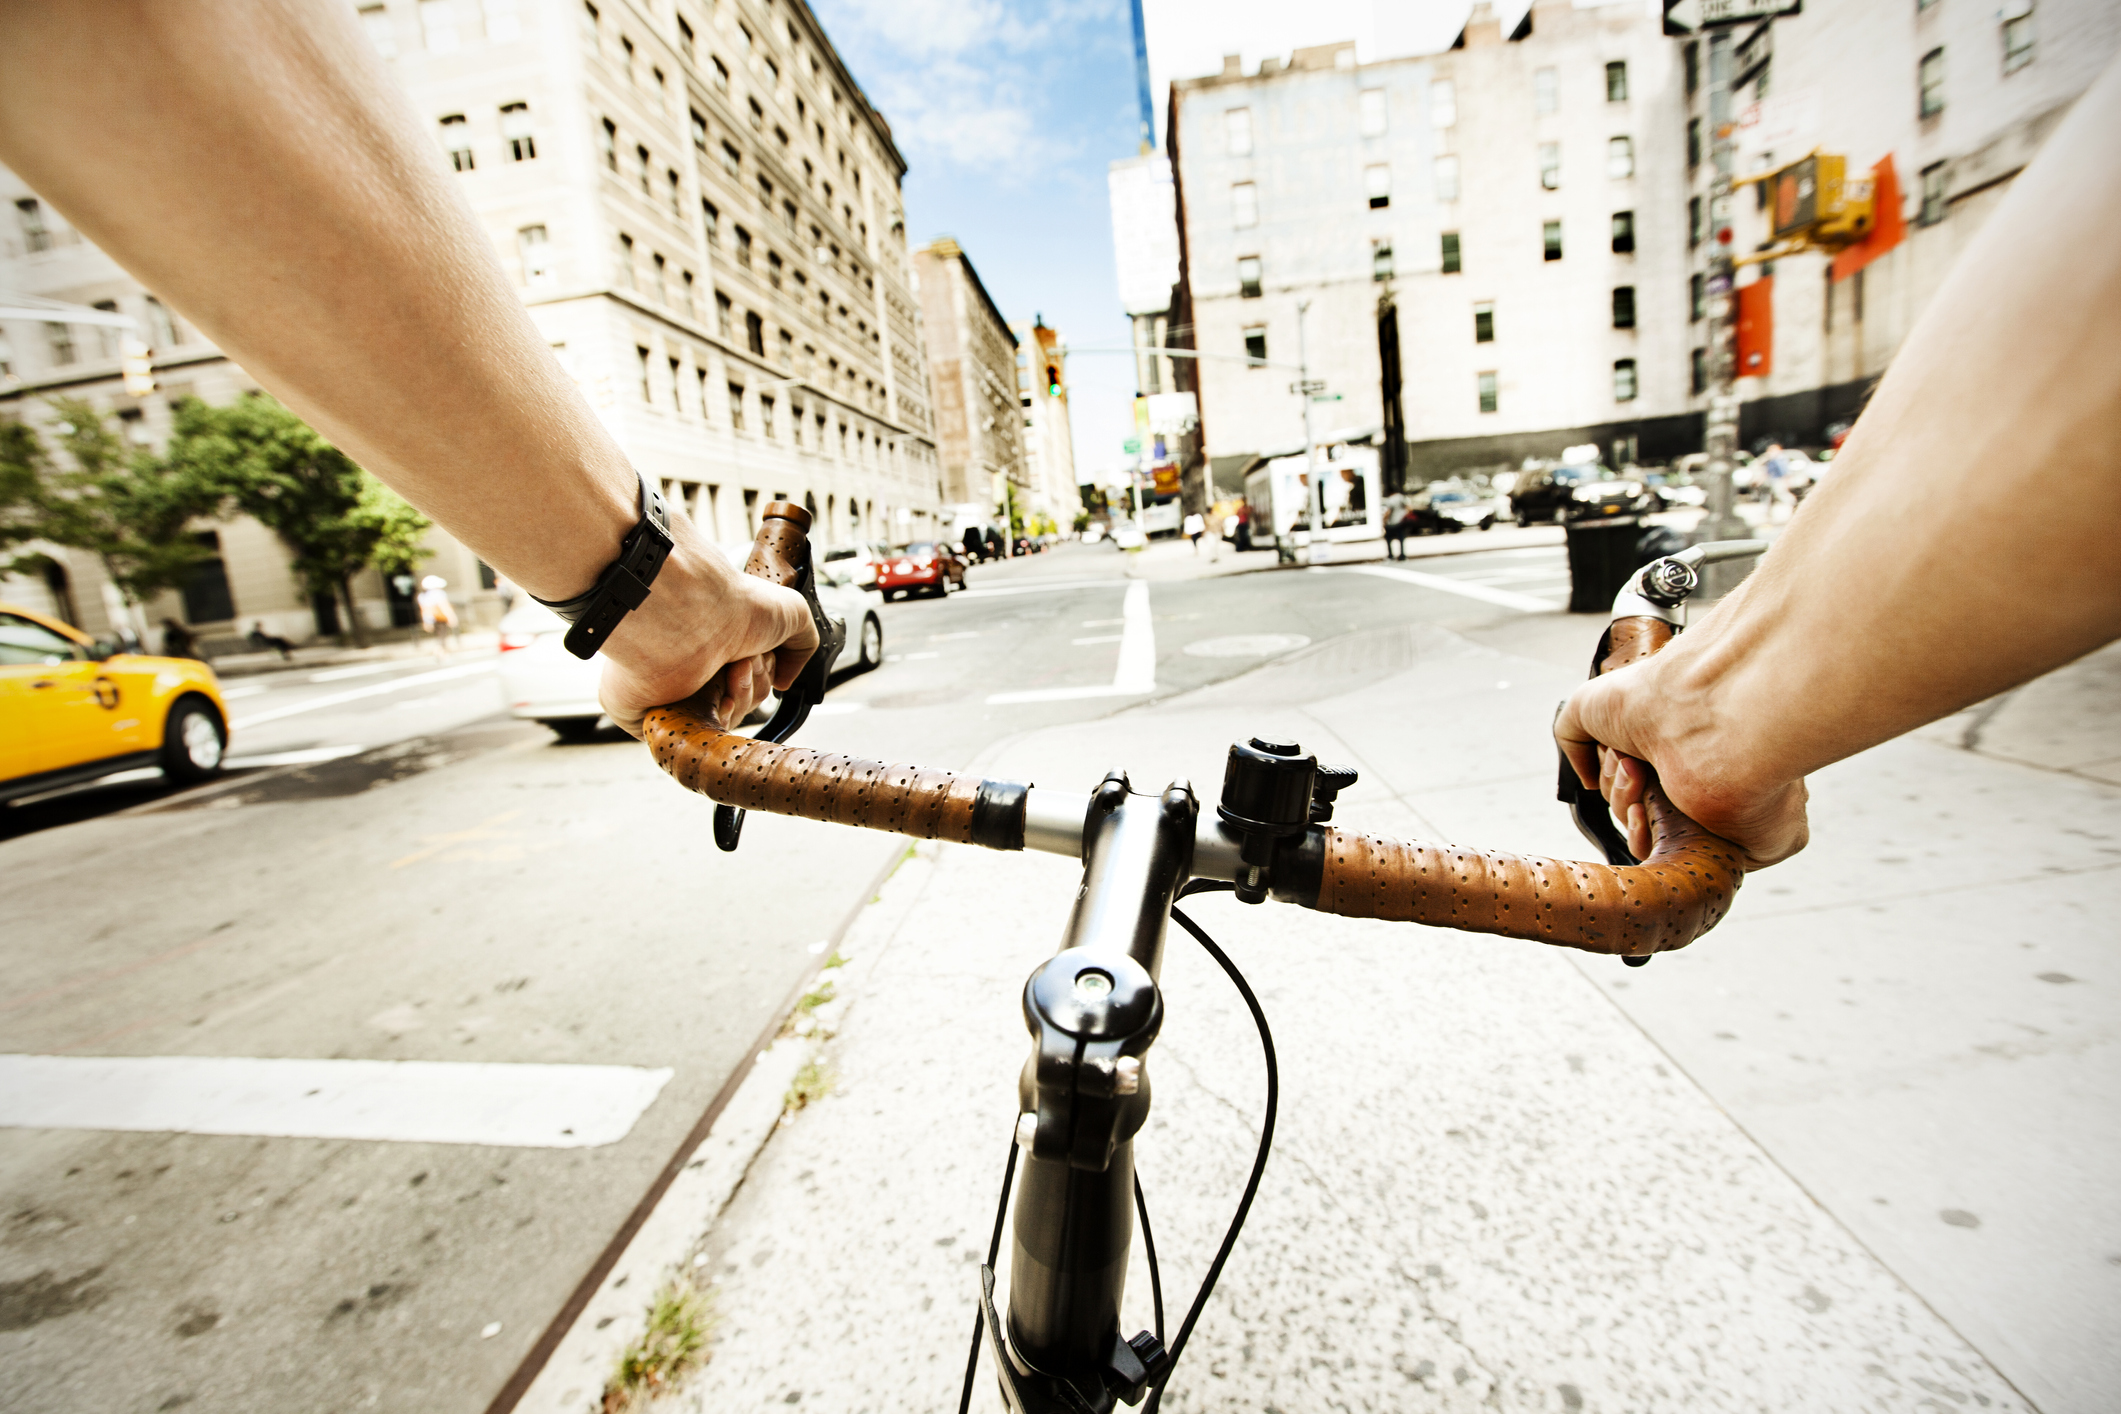
Biking is a great way to check all the boxes of enjoying the outdoors, exercising and exploring options to reduce vehicle dependence. However, whether new to the activity or a seasoned cyclist, we’ve all had an incident or two along the way that we wish we could warn others to help reduce the chances of another sharing a similar experience. A blind corner, a bike path that seems to end abruptly, a close call, or worse, a collision.
Surprisingly, only a third of bike collisions are officially reported and there is no means to report near-misses, such as close calls or narrowly avoided collisions. Thankfully, collisions are a rare event, but near-misses happen much more often and data on this type of incident is crucial to identify precursors of a collision and pinpoint areas. Without a centralized reporting system for these types of incidents, cities often lack the data to make informed decisions about upgrades to their infrastructure.
Creating a new landscape of healthy, safe roadsharing
 COVID-19 undeniably changed the world and along with it, how roadways are or should be used. Cities are reassessing the status quo to provide their community members with enhanced options for walking and cycling. It’s a complex process, and in addition to community feedback, data is essential to proposing a well-informed plan.
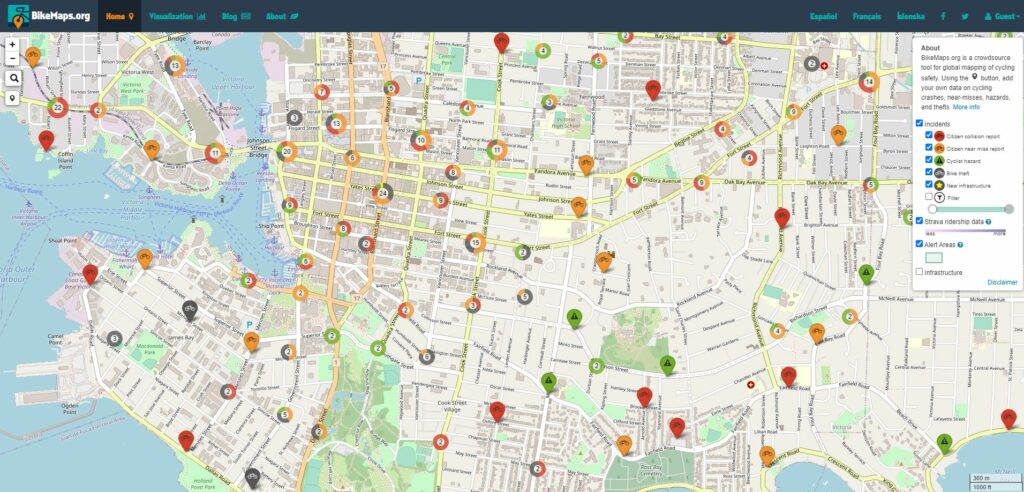
In 2014, University of Victoria researchers created BikeMaps.org – the first of its kind online reporting system designed to collect data on cycling incidents using the power of crowdsourcing, where data is voluntarily submitted by the public via the internet. Pause for applause!!
This web and app-based tool allows mapping of the riding experience along with the ability to report hazards or incidents such as near-misses, collisions or thefts. Reports are anonymous, and a user account is not required to submit data. Upon signing up for an account, riding areas can be defined allowing access to updates on new reports as they occur.
Still not sure mapping cycling incidents is worthwhile?
BikeMaps.org data help supplement official sources of collision data and is analyzed in conjunction with these sources to identify hotspots with higher incidents of certain types of reports. For example, a hotspot map could illustrate a particularly busy downtown street corner has a high incidence of right hooks by turning vehicles, or a bike lane along a main thoroughfare carries greater risks for dooring events. Hotspot maps can be used by municipalities to inform their cycling network, and they can also be used by cycling advocacy groups to demonstrate the need to update unsafe infrastructure. Creating these hotspot maps is also a way of thanking the users who have volunteered their data, because a key part of effectively crowdsourcing data is giving back to those who have graciously taken their time to submit a report.
BikeMaps.org data is also used to answer important research questions about cycling safety. For example, analyses of BikeMaps.org data show areas with bike-dedicated infrastructure have lower incidences of near-miss reports versus areas with no bike-dedicated infrastructure. Moreover, when comparing BikeMaps.org data to official insurance data, results show a higher likelihood reports submitted to BikeMaps.org are at peak hours, at non-intersection locations, and at locations with bike-specific infrastructure. These findings demonstrate how BikeMaps.org data is used to illustrate important aspects of cycling safety and can help to fill the gaps in data that might otherwise go unreported.
Cycling is my life…sign me up!
 There are many ways the cycling community supports each other and now, this useful tool provides cyclists with a new, digital option to support riders within their community and across the world. Travelling outside our communities is something most of us are dreaming of well into the future, but make no mistake, dreaming is happening. Perhaps those dreams include your bike travelling with you to your dream adventure location or signing up for a cycling tour of your favourite part of the world. This handy tool, with the continued support of active users entering incident data, will provide the lay of the land before the tires touch the tarmac. These days may be far off, so in the meantime, wouldn’t it be great to further explore safe cycling options in your town?
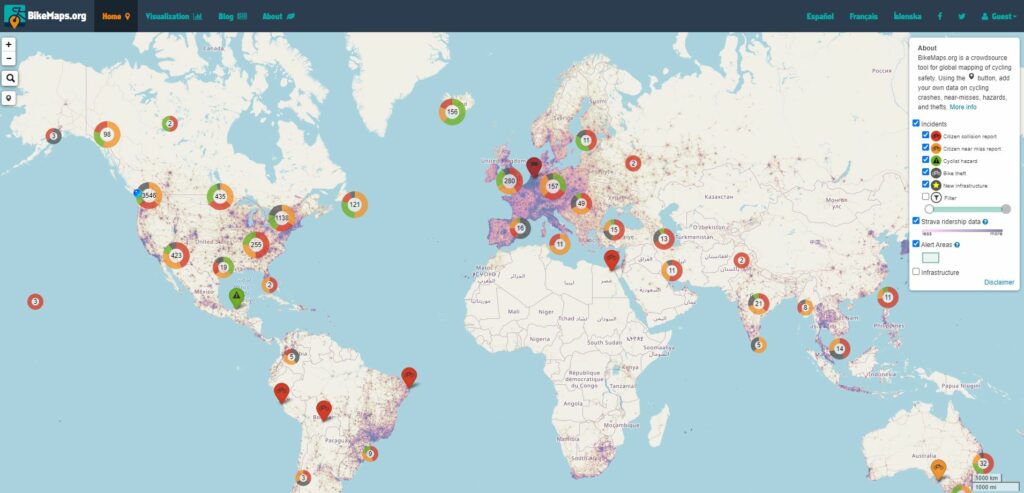
You may be wondering if BikeMaps.org is available in your city, and how you can use this tool to improve cycling safety in your community. Fortunately, BikeMaps.org is available worldwide with over 9,300 reports submitted from riders in over 40 countries, including Iceland, Germany and Australia. There was such a great uptake in the use of BikeMaps.org in Reykjavík, Iceland, the website was translated into Icelandic.
This mapping tool gained particular traction in Victoria, British Columbia, as this is where BikeMaps.org was developed and first launched. Since then, it has received funding from the Public Health Agency of Canada to develop implementation strategies in other Canadian cities (Ottawa, Edmonton, Kelowna, St. John’s, Guelph, Whitehorse, Winnipeg) and evaluate the effectiveness of the tool to promote safe and accessible cycling.
So, next time you are asking yourself who to tell about that cycling incident, consider submitting a report to BikeMaps.org and help them generate safety maps based off of your biking experience.
#MySafeRoadHome blog authors: Heather Woods-Fry, TIRF Research Scientist Scientist and Karen Bowman, Director, Drop It And Drive® (DIAD) program, work collaboratively as co-authors. Heather serves as the project coordinator for BikeMaps.org and is responsible for analyzing the quantitative and qualitative data as part of the evaluation of the BikeMaps.org Public Health Agency of Canada research project. Heather believes in living a balanced and active lifestyle and feels that the accessibility of tools such as BikeMaps.org is essential to promote safe cycling for all Canadians. Karen is TIRF’s Director of Marketing & Communications; she uses her writing and blogging background to help apply TIRF’s research to real-world driving, cycling and walking.
References:
Winters, M., & Branion-Calles, M. (2017). Cycling safety: quantifying the under reporting of cycling incidents in Vancouver, British Columbia. Journal of Transport & Health, 7, 48-53.
Sanders, R. L. (2015) Perceived Traffic Risk for Cyclists: The Impact of Near Miss and Collision Experiences. Accident Analysis and Prevention,Vol. 75, 2015, pp. 26–34. https://doi.org/10.1016/j.aap.2014.11.004.
Branion-Calles, M., Nelson, T., & Winters, M. (2017). Comparing crowdsourced near-miss and collision cycling data and official bike safety reporting. Transportation research record, 2662(1), 1-11.
Related topics:
 |
 |
 |
 |